In my last post I introduced Fundamental Return Moment Estimation. This short post applies the resulting estimates to build superior minimum variance portfolios. Both standard mean-variance-, as well as minimum variance portfolio optimization suffer from estimation errors in the input parameters, which results in poor out-of-sample performance. As you will find out in this post, clustered estimates lift this low-perormance curse.
Cluster Estimates and Minimum variance portfolios
In the first part of this series I introduced cluster estimates obtained using fundamental stock information. For all mean return-, correlation-, and standard deviation estimates, clustered estimates outperformed their simple historical estimate counterpart. Remember, I use fundamental stock information to obtain 10 nearest neighbors for each stock in my sample, seperatly for each cross-section/ step in time. Each stocks estimate is then replaced by the averaged estimate of its peers. Again, I apply a five year rolling window to receive the cluster esimates. This time I do not consider out-of-sample predictability, but portfolio performance of minum-variance portfolios, which are using the clustered estimates as input.
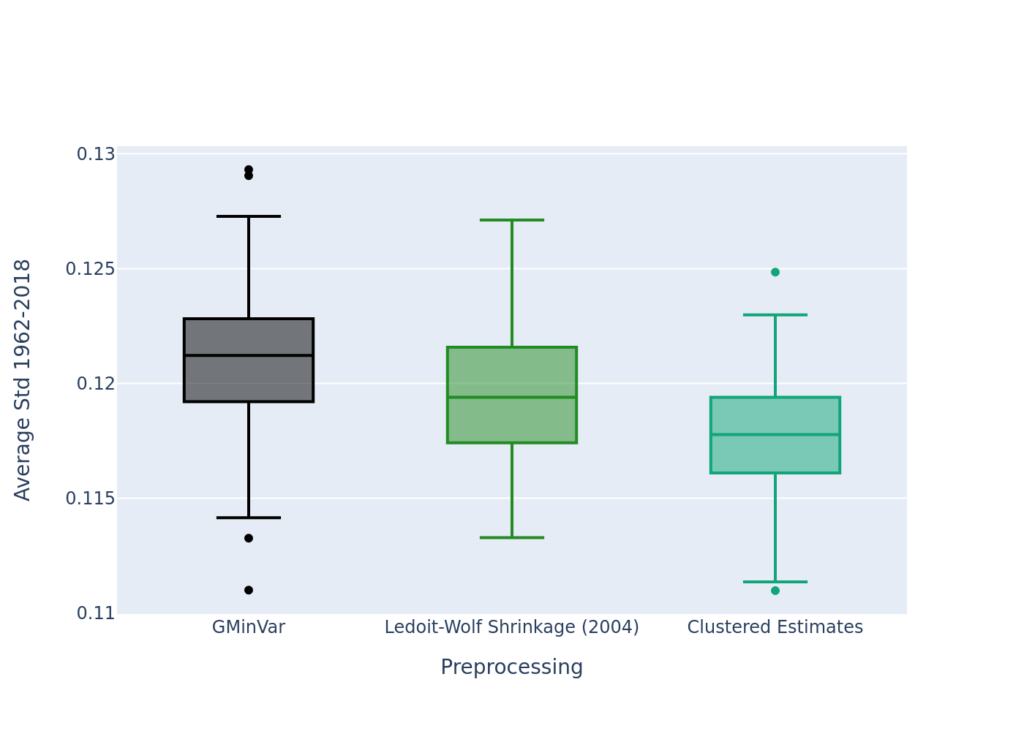
To evaluate the performance of the portfolios, we compare our clustered estimate optimization with a plain historical estimate counterpart. Since it is well-known that this plain estimate performs poorly, we also add one of the major benchmarks in minimum variance optimization, namely a shrunk covariance optimization (Ledoit & Wolf, 2004). Since we only have 60 observations per slide of the rolling window (60 months), we need to restrict our large cross-section. Each year Irandomly draw an investment universe, consiting of 30 stocks, that are used in the optimization. I obtain out-of-sample realized portfolio volatility, and then shift the rolling window by one year. During this shift I redraw 30 new stocks for the next optimization. This is repeated until the window reaches the end of my sample (2018). To overcome issues with lucky draws, I repeat this experiment 1000 times. Since the minimum variance portfolio is intended to minimize portfolio volatility, it is common to compare out-of-sample realized volatility. The realized volatility of all three strategies is portrayed below. As you can see, clustered estimates cleary outperform plain historical estimates, as well as the shrunk covariance portfolios. Thus, the improved estimates from my previous post are also reflected in portfolio performance.